Lesson 2: Let’s talk about ….. Microsoft Power Query by Nicola Filosi
Last time we introduced Power BI Desktop and its main components. Today, we speak of the first of those components. Power Query is a data transformation and data preparation engine. While it is actually available in many Microsoft products and services, we can consider it as the ETL tool of Power BI Desktop (PBI). Remember: ETL means Extract, Transform and Load.
Extract, Transform, and Load: why do we need it and what it is
Preparing data can be a time consuming and, sometimes, daunting activity. If not handled properly, it can delay business processes and decision making. This can happen because of different challenges:
Finding and connecting to data is difficult;
Data needs to be transformed before being ready for the analysis;
Any data transformation is a manual, time-consuming process.
Therefore, it is paramount to have an ETL process that can manage data preparation in the most efficient (less time) and effective (data consistency with business needs) way.
Extract, Transform, and Load (ETL) is a process with which an analyst connects to or copies data from one or more data sources; enforces data quality standards; prepares data according to business requirements; and delivers data in a specific format. Always remember: when we say data, often we are referring to tables and columns. Let’s go through each phase:
Extract: in this first phase we get the data from one or more data sources, such as: a CSV or Excel file, an Access database, a server, and so on. Right after, we must validate it. Validating data means checking whether or not it follows specific rules and patterns, or includes specific values; for example, either in a column or a table. If validation fails, the ETL process stops and can’t be repeated until the data is correct. Finally, we conform all the extractions in a unique format;
Transform: once data is extracted and validated, we transform it by applying functions. The aim of those functions is to pass on only the data we truly need according to business requirements. This phase is also called Data Cleansing. A few examples:
Selecting only certain columns from a wider number;
Changing column names;
Splitting a column into multiple columns;
Aggregating multiple columns in a single column;
Calculating new columns from existing columns.
Load: once the data is finally transformed, it gets loaded into the target destination. This phase is quite straightforward. Actually, the only thing we have to do is pressing a button.
Power Query: the ETL tool of Microsoft Power BI
Now, let’s talk about PBI ETL tool: Power Query. From here on we will focus on its user interface, describe its main components and introduce its most important functions. Power Query user interface is also called Power Query Editor. As a note, the native code that runs Power Query is called M language.
Here below we can find a view of Power Query Editor, split into sections. Let’s go through each of them.

Section 1 (ribbons): here is where the fun happens. In the ribbons, we have all the functions we need to apply changes and transform our data. There are three ribbons: Home, Transform, and Add Column. We will have a look at each of them, and at their functions, in a couple of minutes.
Section 2 (left pane): this section displays the number of active queries and their names. You can think of “Extraction” and “Query” as synonyms. Indeed, a query is nothing more than a connection between PBI and one or more data sources. The result of a query is a collection of tables and columns.
Section 3 (center pane): in this segment, we have a snapshot of the data itself. It is organized in tables, columns, and rows. Each column has a name, and a type, such as: number, currency, percentage, decimal number, and so on. Each row is uniquely identified by a number showcased in the black column on the left.
Section 4 (right pane): here we have two important things. First, the query name: we can change it as we see fit. Second, the Applied Steps pane. Applied Steps lists all the transformations applied to columns, rows, and tables. Should we decide to remove any transformation, we would simply have to click on the “x” to the left.
And now, let’s have a look at Power Query true toolset: the ribbons. As a note, sometimes the functions in the ribbons overlap a bit. Don’t be afraid: the meaning of the same button is the same, regardless of its place.
The Home ribbon is where everything begins. It is organized in segments.
Close: this is what we press to “Load” the data in PBI, the last phase of the ETL process.
New Query: this section helps us in connecting to new data sources. The most important button here is “New Source”. Through it, we decide to what data sources we want to connect, and to how many.
Manage Columns and Reduce Rows: the former reduces or maintains the number of columns in one or more tables, while the latter reduces or maintain the number of rows in one or more tables.
Sort: it allows us to sort a column alphabetically, in descendent or ascendant order.

The Transform ribbon provides access to common data transformations tasks. It is divided in sections. Each section is about a different kind of column:
Any column: used to determine the data type of a column(general, number, currency, percentage, decimal number, text), to rename a column, or to substitute generic values with others more specific;
Text column: here we can split a column in multiple columns, or merge multiple columns in a single one. We also can give a specific text format to our text values;
Number column: the functions included here are used specifically to better understand data by exploring it and gathering the first insights: in particular, this is the purpose of Statistical and Standard functions (variance, standard deviation, minimum, maximum).
Date & Time column: used to perform specific operations on Date & Time data, such as: the interval between a starting date and an ending date.

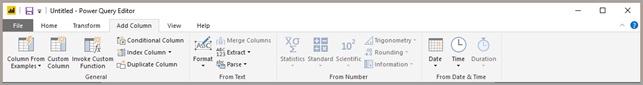
The Add Column ribbon focuses on adding columns to the data tables, applying specific conditions:
Column From Examples: this function add a column which takes its values from other columns;
Custom Column and Conditional Columns: these buttons have a similar purpose. They add columns to a table. The values of those columns are generated following specific conditions imposed by us.
Index column: here we can add a very specific column. It embeds a single numeric integer value per each row of a table. In this way, each row of a table is uniquely identified.
The other sections of this ribbon are quite similar to the ones we already described in the Transform ribbon.
Want to know more about Power Query and see some practical examples of what we talked of? Have a look at the following videos from Microsoft. They focus on connecting and transforming data. Just copy the link on the right in your web browser navigation bar.
Video 1: connect to an access database bit.ly/2FSBNdQ
Video 2: basic transformations in Power Query bit.ly/2HdYv0m
Video 3: splitting columns bit.ly/2RLLI7k
Video 4: conditional columns bit.ly/3j4xPgw
We’ve come to the end of this article about Power Query, its logic, and its main components. Next time, we will start delving in the second of the three phases described here above: modelling with tabular data models.

About the Author
Nicola Filosi, MCSE is a graduate student at the UCD Michael Smurfit Graduate Business School studying Business Analytics. He is interested in Data Analysis, Data Modelling, Data Visualisation, Reporting, Performance and Financial Analysis